
Your dashboard says 4,200 customers completed onboarding training last quarter, and the completion rate is a healthy 87%. You bring this number into the leadership meeting, feeling pretty snazzy about it. But the CFO doesn’t even blink before they ask what the business impact was.
Nobody's asking if people finished customer training. They’re more interested in if customer education initiatives drove business goals. To be more specific:
Did those 4,200 customers adopt faster, call support less, renew at a better rate, or expand their accounts? Your dashboard, for all its green checkmarks, doesn't answer those. It tells you who showed up, but not what changed.
Your report isn’t a failure, but it’s the bottom rung of a ladder that has several more above it — and the view from up there is what convinces a room full of skeptics. This article climbs that ladder with you, one rung at a time, from "people watched the videos" all the way to "trained accounts renew at a measurably better rate, and here's how we know."
Why completion rates aren't enough — and aren't useless either
Start at the bottom of the ladder, where most measurement conversations live: completion rates. They’re not the enemy — but they’re not the whole story either.
Completion data is not nothing! Let's be fair to completion data because it tells you that people engaged. It's the easiest number to pull from any LMS, and for compliance or certification programs, it might genuinely be the whole story.
The trouble starts when completion gets asked to do the job of proving business impact. (It was never designed to.) A customer can finish every module in your onboarding course and still fail to configure the one workflow that actually matters to their team. Another customer might skip the formal training entirely — their admin already knew the product from a previous job — and reach value faster than anyone who sat through every lesson.
Training metric | What it proves | What it doesn't prove |
Course completions | Customers engaged with the material | Whether they understood it or acted on it |
Attendance | Customers showed up | Whether the session changed behavior |
Certification count | Customers passed an assessment | Whether the skill transferred to real use |
High-return and low-return programs aren't tracking different things. What separates them is what happens after the number arrives. High-return programs act on what they collect — 38% use engagement data to improve content, 31% use it to trigger customer outreach. Low-return programs are more than twice as likely to simply report the data and stop there: 14% do, versus 5% of high-return programs. Every return-rate group in the survey — high, medium, and low — names enrollments as their top executive metric.
There's a confidence gap hiding underneath these numbers, too. Programs that call themselves very confident in their ROI story tie education to an average of 3.2 business outcomes; programs that are only somewhat confident tie it to 2.6. That reads like stronger evidence until you look at which outcomes each group is confident about. The very-confident group anchors mostly to retention, customer loyalty, and brand loyalty, outcomes that are genuinely important and genuinely hard to disprove. The less-confident group is more likely reporting on compliance and support cost reduction — harder, operational outcomes that require showing a number. Confidence, in other words, may say more about how little the measurement is being challenged than about how much evidence supports it.
Completion is real evidence. Just be realistic that leadership is standing several rungs higher, waiting for you to join them.
The customer education KPI ladder
There’s a climb ahead. But the higher you get, the better your view. Each rung you climb asks a harder, more specific question than the one below it — and each rung's answer carries more weight with the people deciding your budget.
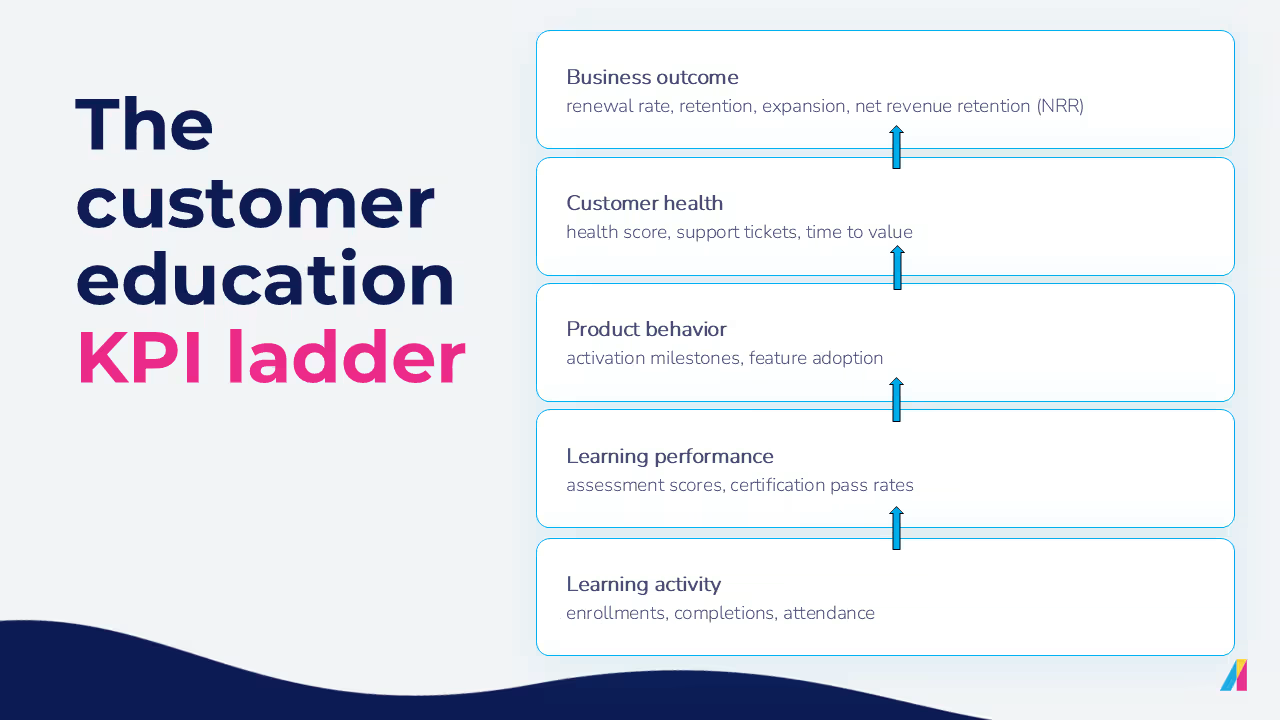
- Rung one: learning activity. Did customers engage with training at all? Enrollments, completions, attendance, course progress. Not a destination, this is a solid starting point.
- Rung two: learning performance. Did they understand it? Assessment scores, certification pass rates, scenario performance. A customer who passes a scenario-based assessment has demonstrated more than a customer who clicked through to the end — this rung filters engagement from comprehension.
- Rung three: product behavior. Did training change what customers do in the product? Activation milestones, feature adoption, completed workflows, correct admin configuration. This is where training data starts touching something the product team already tracks, which makes it instantly more credible.
- Rung four: customer health. Did training support the account's overall success? Health score movement, support ticket trends, usage depth, time to value. Now you're talking the same language as your CS leadership's own dashboard.
- Rung five: business outcome. Did trained customers perform better commercially? Renewal rate, retention, churn reduction, expansion, net revenue retention influence. This is the rung that gets you the budget — and the one that demands the most caution, because it's also the easiest rung to overclaim from.
Where you are on the customer education ladder | Example KPIs | Evidence strength |
Learning activity: Did customers engage? | Enrollments, completions, attendance, course progress | Early signal |
Learning performance: Did they understand it? | Assessment scores, pass rates, scenario performance | Stronger learning signal |
Product behavior: Did it change product use? | Activation milestones, feature adoption, workflow completion | Behavior signal |
Customer health: Did it support account success? | Health score movement, ticket trends, time to value | Account impact signal |
Business outcome: Did it move the commercial number? | Renewal, retention, expansion, NRR influence | Business impact signal |
Notice the climb gets harder to prove at exactly the rate it gets more convincing to leadership. That's why teams that only report rung one stay stuck defending vanity metrics, and teams that climb to rung four or five get asked fewer skeptical questions in the room.
A certification, on its own, sits at rung one or two. Connect that same certification to whether the certified admin configured the product correctly, invited their team, and completed activation milestones — and you've climbed two rungs without collecting a single new piece of data. You just connected what you already had.
Pick your KPIs by business goal, not by what's easiest to export
The ladder tells you how strong your evidence is. It doesn’t tell you which rung to aim for — that depends entirely on what your program is actually accountable for this year.
What problem is the education team actually trying to solve? That's the only thing that tells you which metrics matter. The ladder just tells you how strong your evidence is once you've picked them.
Look at what programs formally tie to education today and a pattern shows up fast: customer retention leads at 59%, followed by deeper loyalty (43%), brand loyalty (39%), compliance (37%), product adoption (29%), revenue expansion (26%), support cost reduction (24%), and time to value trailing at just 19%. Time to value is one of the earliest, most provable metrics on this ladder — and it's the one fewest programs formally connected to education. Most measurement is still anchored to relationship outcomes that feel important and are hard to argue with, not the operational outcomes that are easiest to prove.
If the goal is faster onboarding, completion rate isn't your finish line. The sharper question is whether trained customers hit activation milestones faster than customers who skipped training. If the goal is support deflection, the metric isn't course views — it's whether ticket volume on covered topics actually drops afterward. If the goal is retention, you're tracking whether trained accounts show fewer churn signals than untrained ones in the same segment.
Business goal | KPI & CRM/CS signal | What it helps prove |
Onboarding and time to value | Time to first activation milestone · Onboarding stage in CRM | Training shortens ramp-up |
Product adoption | Feature adoption rate post-training · Product usage analytics | Training translates to actual use |
Support deflection | Ticket volume on trained topics · Help desk category tags | Self-service reduces support load |
Retention and renewal | Churn signal frequency, renewal rate · Account health score, renewal date | Trained accounts behave differently |
Expansion | Upsell/cross-sell rate among trained accounts · Opportunity stage in CRM | Education supports growth, not just retention |
Pick two or three of these tied to whatever your team is actually accountable for this year. A KPI dashboard with twelve metrics and no priority is just a longer version of the vanity-metric problem.
"Measuring time to value in customer education only works if it's tied to a clear activation milestone. You can't just look at logins or training completions — it has to be a moment of real usage where the customer gets a tangible outcome. The strongest predictor of retention is whether a customer is actually using the core parts of the product after onboarding. If they're not, churn is inevitable." — Darren O'Connor, Director, Customer Success
How to connect LMS data to CRM outcomes
It’s time to turn "we think training helps" into "here's what we can show you." This isn’t a math issue, but mostly an architecture problem. “There are so many different systems we use. It's a little bit hard to track the ROI. You're piecing together many different systems to get the whole picture,” one customer education leader said. Another described the CRM half of the problem just as bluntly: “Getting a Salesforce connector to my learning management system was a huge undertaking. There was no chance I could get actual product usage data tied to who was in the academy.” Both quotes come from practitioners surveyed for the State of Customer Education 2026 report — and they're exactly what the steps below are built to fix.
- Map learners to accounts. Every learner record needs to tie back to a CRM account ID. Without that link, you have a pile of individual training data and a separate pile of account data, and no way to introduce them to each other.
- Connect training engagement to customer health. Once the mapping exists, training activity can sit next to health score, support ticket history, and adoption milestones for the same account. Don’t do this as a separate report, but as another column in the same view your CS team already checks.
- Compare cohorts carefully. If trained accounts renew at a higher rate than untrained accounts, that's a real signal worth bringing to the room. It gets considerably stronger once you've also checked that the two groups look similar on the variables that usually explain renewal anyway — account size, segment, product usage, and how much CSM attention each one got. Skip that check and a sharp analyst in the room will do it for you, out loud.
- Share the comparison, don't sit on it. A trained-versus-untrained view is most useful when CS, RevOps, and leadership can all see it — not when it lives in a slide deck that gets dusted off once a quarter.
Step | What connects | Why it matters |
Map learners to accounts | LMS learner ID ↔ CRM account ID | Without this, training data and account data never meet |
Connect to customer health | Training engagement ↔ health score, tickets, usage | Puts training in the same view CS already trusts |
Compare cohorts | Trained accounts ↔ untrained accounts | Surfaces a real signal, not just a hopeful one |
Share the data | LMS reporting ↔ CRM/CS dashboards | Keeps the connection visible, not buried |
This doesn't require perfect infrastructure to be useful. At Charles River Development, Julie Cochrane's team cross-references annual NPS scores at the account level against LMS engagement data — no product telemetry integration required. When an account reports high demand for training but shows low actual engagement, that gap becomes the trigger for a CS conversation at the next QBR. It's a working version of the model above, built for an environment where the systems don't all talk to each other yet.
A word on the obvious trap here: correlation isn't causation, and a trained account renewing more often doesn't prove training caused the renewal. It proves trained accounts and renewal are connected — which is still a genuinely useful thing to know, as long as you say it the way it really is.
A quick scorecard: is your measurement working?
Before you build another dashboard, it's worth checking whether the foundation underneath it can support one. This is a gut check, not a vendor checklist.
Evaluation question | Why it matters | Signal |
Can we see training engagement by account, not just by individual learner? | Account-level visibility is what makes CRM connection possible | Strong: CS can pull up an account and see its training history · Weak: Training data is siloed in the LMS with no account view |
Can CS see which of their customers are trained? | Determines whether the data is actually usable day to day | Strong: Training status shows up in the CS team's normal workflow · Weak: CS has to ask the education team for a manual pull |
Can we compare trained vs. untrained cohorts? | This is the comparison that produces a real signal | Strong: A standing report exists and gets checked · Weak: The comparison has never actually been run |
Can we identify where customers drop off? | Drop-off points are where the journey itself needs fixing | Strong: Drop-off data is reviewed and acted on · Weak: Nobody's looked at this past the launch month |
Can we connect education to adoption or support trends? | This is rung three and four of the ladder, working in practice | Strong: Education data sits next to product and support data · Weak: Education data lives alone, unconnected to anything else |
If most of your answers land in the weak column, that's not a failure — it's just telling you where to invest next. Usually it means the first fix isn't a new metric. It's the account-level mapping that makes every other metric on this list possible.
Customer education impact is a connected signal, not a single number
Nobody's measurement problem gets solved by one better completion dashboard. It gets solved when training engagement connects to product behavior, customer health, and the business outcomes your leadership already tracks — so that when someone asks "did it work," you're answering with a chain of evidence instead of a single number that can't hold the weight of the question.
Climb the ladder deliberately. Pick the KPIs that match your actual business goal. Build the account-level connection before you build the dashboard on top of it. And once measurement is solid, the next conversation is usually about whether your current systems can even support that level of connected data — which is exactly the question our guide to building a business case for a dedicated customer LMS digs into.